Competitive equity in high school sports
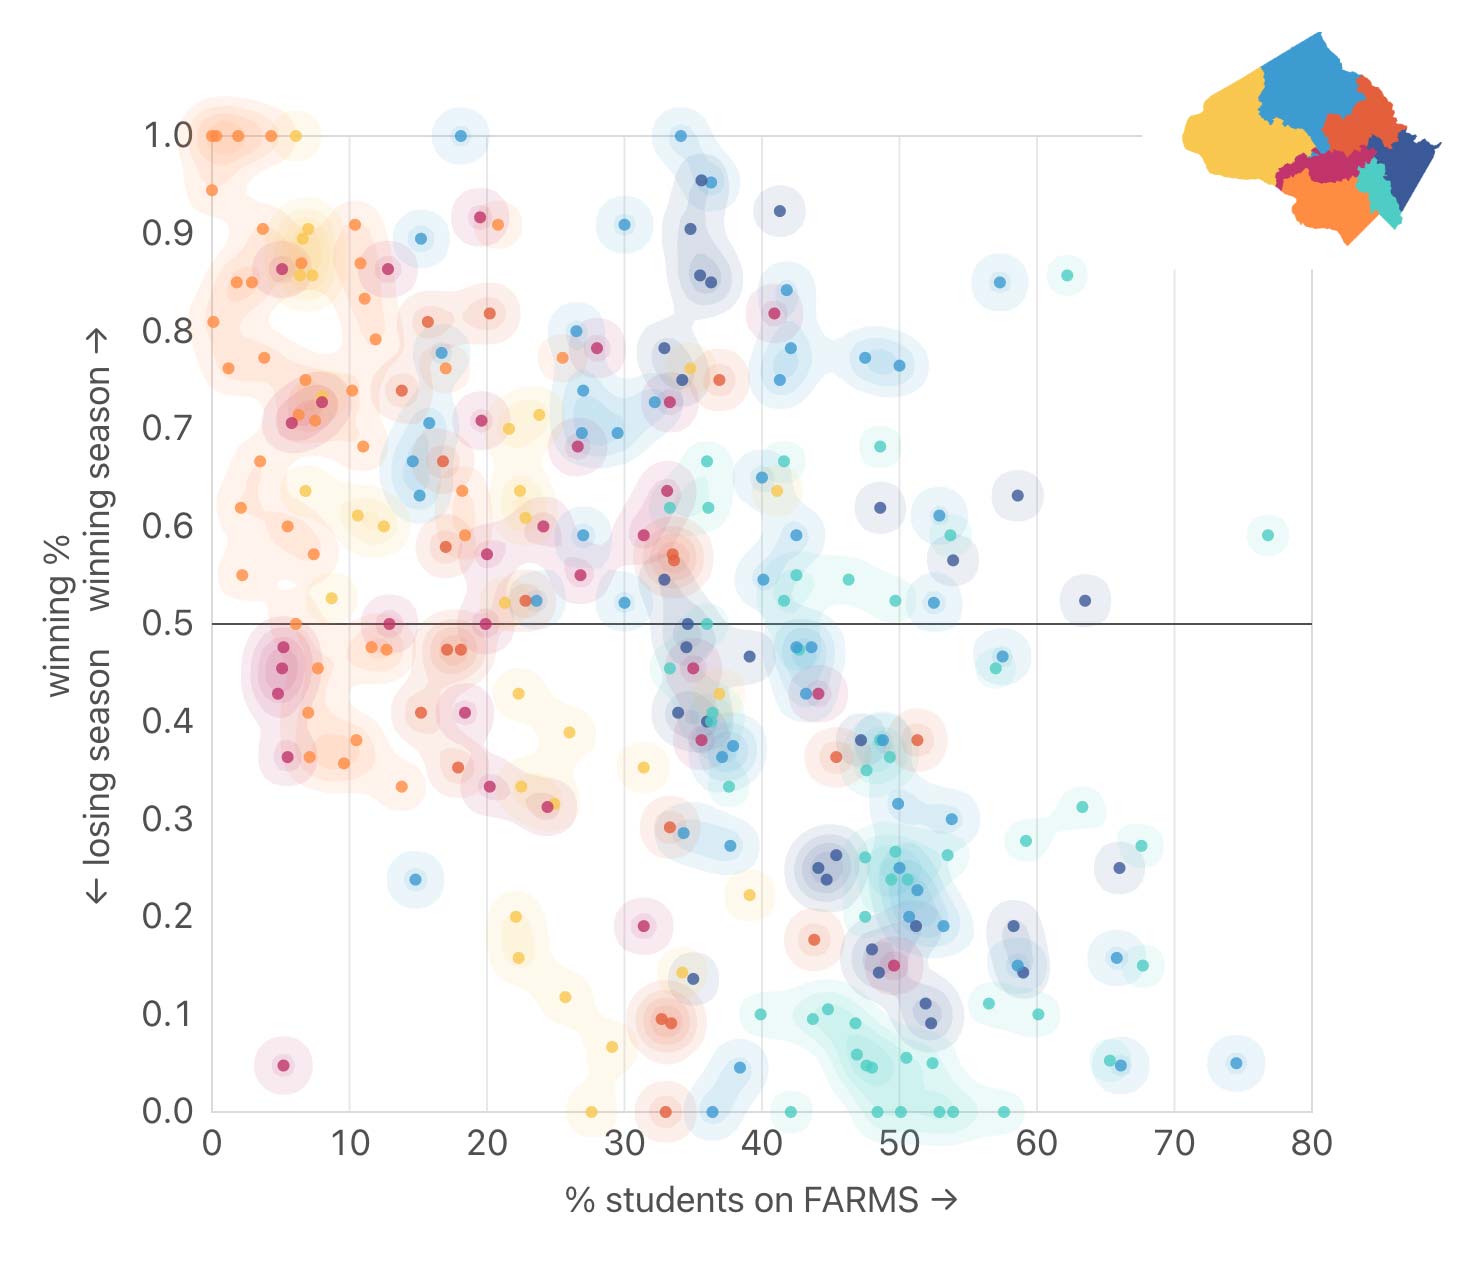
Project: Analyze historical high school basketball game data and school demographic information to look for correlations between sports team success and school demographics.
Solution: Used data analysis and visualization tools to gather 10 seasons of girls' basketball game result data—as well as Montgomery County Public Schools demographic information—and process and visualize the data.
Tools used include:
- Python, Pandas, and Jupyter Notebook: data scraping, cleanup, and analysis
- Tabula: PDF data extraction
- Excel and BBEdit: data review
- Observable Plot: data visualization
Comprehensive design packages for government and nonprofit institutions.
info@takomadesign.com
301-920-0192