Data visualizations on gender equity in sports in Montgomery County, Md. public schools
Project: In February 2022, Montgomery County, Md., published OLO Report 2022-03, Gender Equity in Local Sports Programs, findings on gender in sports in its public schools and in public and private recreation programs in the county.
Much of the data in the report is presented as tables, which I wanted to make more accessible through a series of data visualizations.
Solution: Used Excel, Python, and Tableau to create a series of data visualizations.
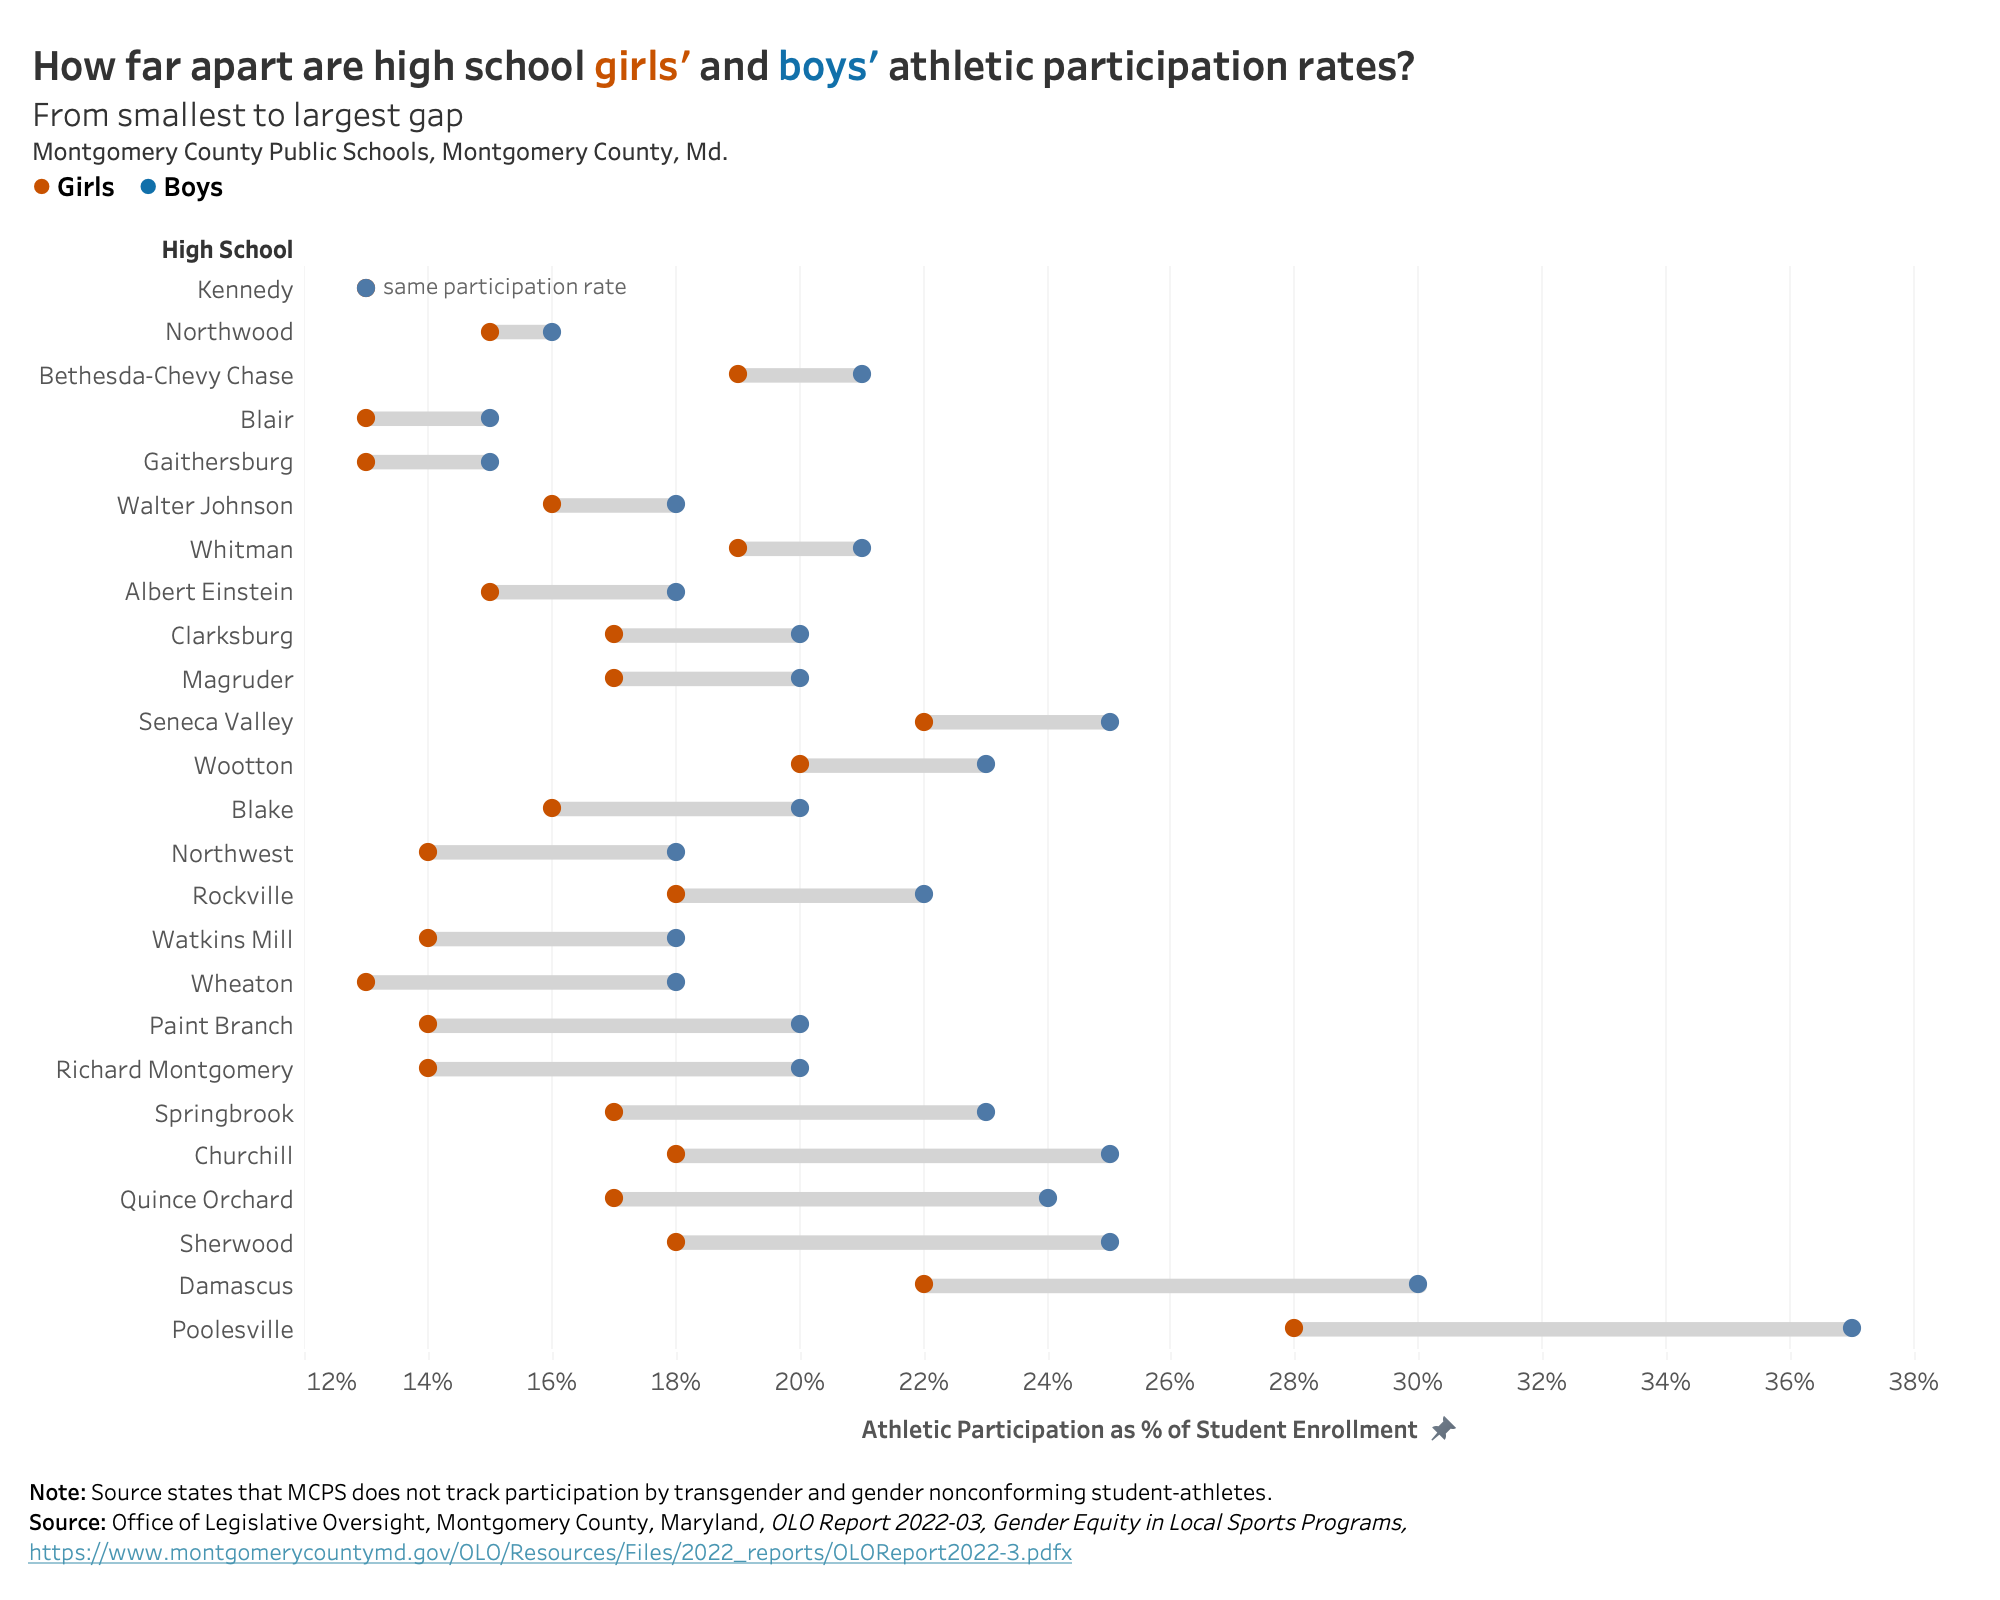
Barbell chart comparing girls' and boys' participation rates by school

Scatter plot showing decreasing participation versus increasing FARMS rates

Comprehensive design packages for government and nonprofit institutions.
info@takomadesign.com
301-920-0192